

Debugging JavaScript in Visual Studio Code: Tips and Tricks
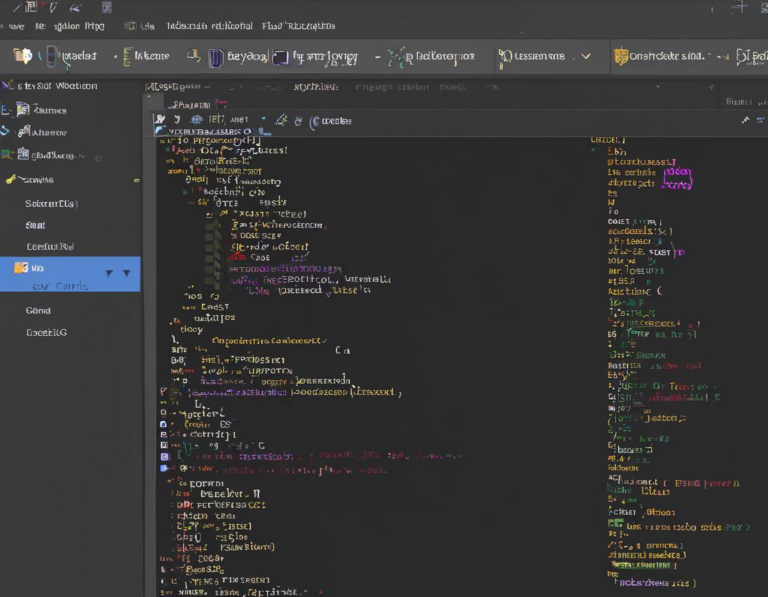
Visual Studio Code (VS Code) has become the go-to editor for many developers, thanks to its powerful features and robust extensibility. One of its most valuable features is the integrated debugger, which empowers developers to efficiently track down and fix errors in their JavaScript code.
This article will explore various debugging techniques in VS Code, providing you with the knowledge and skills to confidently troubleshoot your JavaScript projects.
1. Setting up the Debugger in VS Code
Before diving into debugging techniques, you need to set up the debugger in VS Code. This involves configuring launch settings and understanding how to launch your code in debug mode.
1.1 Creating a launch.json File
VS Code automatically creates a launch.json file when you first attempt to debug your project. This file acts as a configuration file, defining the different debug configurations for your project. You can customize these configurations to suit your specific needs.
1.2 Understanding Common Debug Configurations
Program: This configuration is used to debug a single JavaScript file or an entry point to your application.Attach: This configuration allows you to attach the debugger to a running process, such as a web server or browser.Chrome: This configuration is specifically designed for debugging JavaScript code running in the Chrome browser.
1.3 Setting Breakpoints
Breakpoints are essential for debugging, allowing you to pause the execution of your code at specific points. Simply click in the gutter next to the line number in your code to set a breakpoint. A red dot will appear, indicating the breakpoint.
2. Stepping Through Your Code: A Guided Tour
The most common debugging technique is stepping through your code line by line. VS Code’s debugger provides several stepping commands, each serving a specific purpose:
2.1 Step Over (F10)
The “Step Over” command executes the current line of code and moves to the next line. If the current line contains a function call, the function is executed, but you won’t step into its code.
2.2 Step Into (F11)
The “Step Into” command executes the current line and, if the line contains a function call, steps into the function’s code. This allows you to inspect the code execution within the function.
2.3 Step Out (Shift + F11)
The “Step Out” command executes the remaining lines of the current function and returns to the caller function.
3. Inspecting Variables and Expressions: Unraveling the Code
While stepping through your code is useful, it’s often necessary to inspect the values of variables and expressions to understand the program’s behavior. VS Code’s debugger provides several ways to inspect this information:
3.1 The Variables Pane
The Variables pane displays the values of all variables currently in scope. You can expand objects and arrays to inspect their properties or elements.
3.2 The Watch Pane
The Watch pane allows you to monitor the values of specific variables or expressions. You can add expressions to the Watch pane by clicking the “+” icon.
3.3 Evaluate Expression
The “Evaluate Expression” feature lets you evaluate expressions in the context of your code. This allows you to calculate values or test the results of operations. You can access this feature by right-clicking on a variable or expression and selecting “Evaluate Expression.”
4. Conditional Breakpoints: Targeting Specific Cases
Conditional breakpoints allow you to pause your code only when certain conditions are met. This is particularly useful when debugging complex logic or specific cases.
4.1 Setting Conditions
To set a conditional breakpoint, right-click on the breakpoint and select “Edit Breakpoint.” In the dialog box, you can enter a JavaScript expression. The breakpoint will only be triggered when the expression evaluates to true.
4.2 Examples of Conditional Breakpoints
- Break when a variable reaches a certain value:
variableName === 10 - Break when an array contains a specific element:
myArray.includes("value") - Break when a function is called with specific arguments:
functionName(arg1, arg2)
5. Debugging in the Browser: Chrome DevTools Integration
Debugging JavaScript code running in a web browser often requires a different approach. VS Code offers seamless integration with Chrome DevTools, providing a comprehensive debugging environment.
5.1 Launching the Debugger
To debug in Chrome, you can use the “Chrome” configuration in your launch.json file. This configuration will launch the Chrome browser and attach the debugger to the specified URL.
5.2 Using Chrome DevTools
Once the debugger is attached, you can access all the features of Chrome DevTools, including:
- Console: For logging messages and running JavaScript code.
- Elements: For inspecting the DOM and CSS styles.
- Sources: For viewing and debugging your JavaScript code.
- Network: For analyzing network requests and responses.
6. Handling Runtime Errors: Catching Exceptions
Runtime errors, such as TypeError or ReferenceError, can often be difficult to debug. VS Code’s debugger provides features to handle these errors gracefully.
6.1 Breakpoints on Exceptions
You can set breakpoints that are triggered whenever an exception is thrown. This allows you to examine the call stack and inspect the error object.
6.2 Conditional Breakpoints for Exceptions
You can further refine these breakpoints by setting conditions based on the exception type. For example, you can break only on TypeError exceptions.
6.3 Debugging Uncaught Errors
By default, the debugger might skip over uncaught errors. You can configure the debugger to break on all uncaught errors, providing more visibility into unexpected behavior.
7. Tips for Effective Debugging
Here are some additional tips and tricks for enhancing your debugging experience in VS Code:
- Use
console.log()for quick diagnostics: While the debugger is powerful, sometimes a simpleconsole.log()statement is all you need to inspect a variable’s value. - Utilize
debuggerstatements: Thedebuggerkeyword pauses the execution of your code at the line where it’s placed. It acts as a temporary breakpoint. - Take advantage of the “Call Stack” pane: The Call Stack pane shows the sequence of function calls that led to the current execution point. It helps trace the flow of code execution.
- Experiment with “Run and Debug”: The “Run and Debug” feature in VS Code allows you to quickly run your code in debug mode without configuring a launch configuration.
- Learn to use the “Command Palette”: The Command Palette, accessible with
Ctrl + Shift + PorCmd + Shift + P, provides a quick way to access various debugging commands and settings.
8. Debugging Frameworks and Libraries
Many popular JavaScript frameworks and libraries offer specific debugging features that work seamlessly with VS Code.
- React: React offers a dedicated debugger extension for VS Code, allowing you to inspect the React component tree and its state.
- Angular: Angular provides a set of tools and extensions for debugging Angular applications, including component inspection and dependency injection analysis.
- Vue.js: Vue.js provides debugging features through its Devtools extension, which is available for Chrome and Firefox.
9. Resources for Further Learning
To delve deeper into the world of JavaScript debugging in VS Code, consider exploring these valuable resources:
- VS Code Debugging Documentation: https://code.visualstudio.com/docs/editor/debugging
- JavaScript Debugging in VS Code: A Beginner’s Guide: https://blog.logrocket.com/debugging-javascript-visual-studio-code/
- Debugging JavaScript in Chrome DevTools: https://developers.google.com/web/tools/chrome-devtools/javascript
Conclusion
Mastering debugging in VS Code is crucial for any JavaScript developer. From setting up the debugger to stepping through code, inspecting variables, and handling runtime errors, the techniques and tools discussed in this article equip you with the essential knowledge to efficiently troubleshoot and resolve issues in your JavaScript projects. As you gain experience, you’ll find that debugging becomes less of a chore and more of a tool for understanding and improving your code.